...
Investigating performance when changing options
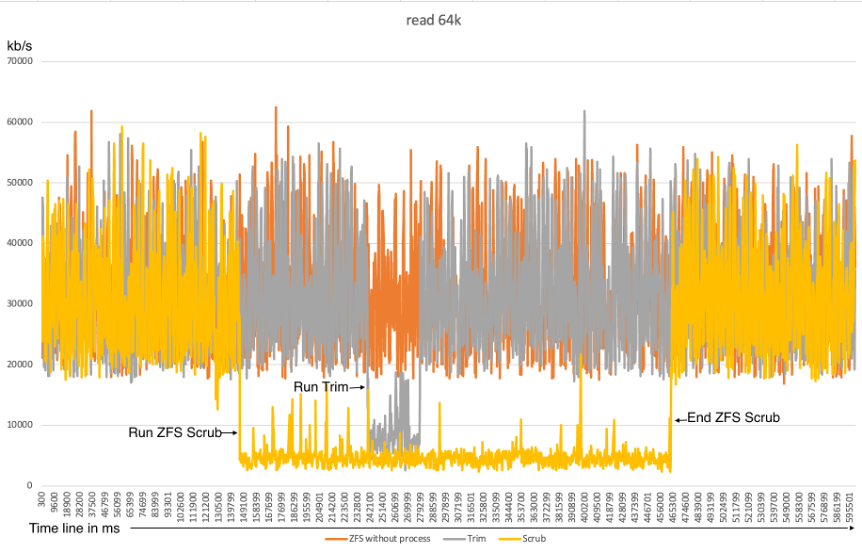
Explanations for the chart:
This graph depicts 3 read performance tests under the same conditions and shows the impact of TRIM and Scrub
commands on performance during these tests.
- The orange color indicates a test in which no commands were executed, i.e. clean test.
- The gray color shows the test in which the TRIM command was run, so we can observe short a performance drop when running this command.
- The yellow color shows a test in which the Scrub command was run, which resulted in performance degradation on most of the test.
Thus, this graph gives a visual understanding of the impact of the TRIM and Scrub commands on the performance of read operations.
TRIM command
The problem with this command is that a significant performance drop (more than 50%) occurs only for
the read performance when it is executed. For this command, after testing and checking, it was determined that changing
only one zfs_trim_queue_limit option to a value of 5 reduces the drawdown to 30-35%. Changing the rest of
the trim_min_active and trim_max_active commands does not produce a positive effect, since they are already
at their minimum values. The Trim command has almost no effect on write performance (Permissible performance degradation within 5 - 7%).
...